|
Add background image to library
Create a style for page
Create a style for trace graph col-blue
Create a style for trace graph col-red
Create Variables for graph
Num-point no Rand-Random Number (Yposn) Set-set interval(XPosn)
FuncV-which graph to draw GraphSel-name of grph to draw
Create array for 2 graphs X and Y Points with 22 points
Create function that creates array values
Loop goes round 22 times
Calculates a number from 0-189.99 and stores in Rand variable
Loads the array Y value with the Random number for desired graph
Loads the array X value with the Set number for desired graph
Increments the Set number by 20
Increments the Num by 1
Reset the Num and Set variable so function can be re-run
Define a page named "pageName" using "pageStyle"
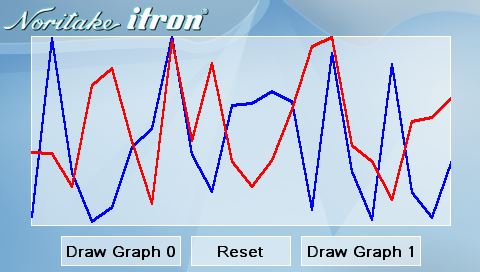
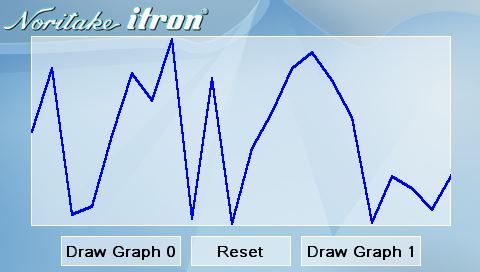
Draw graph0 420 x 190 at 240,130
Draw graph1 420 x 190 at 240,130
Create Key for Graph0 draw with inline function that loads which graph todraw and runs graphdraw function
Create key that resets both of the graphs
Create Key for Graph0 draw with inline function that loads which graph todraw and runs graphdraw function
Create Function that Draws Graphs
Run Loop to load array with values
Load variable with which graph to has been selected
Reset the selected graph
Draw the selected graph with X and Y points from array
After loading show the page
|
LIB(background,"SDHC/bground.png");
STYLE(pageStyle, Page) {image=background;}
STYLE(gstyle,DRAW){type=trace;col=blue;back=none;width=2;curRel=CC;}
STYLE(gstyle2,DRAW){type=trace;col=red;back=none;width=2;curRel=CC;}
VAR(Num,0,U16);VAR(Rand,0,U16);VAR(Set,0,U16);
VAR(FuncV,0,U8);VAR(GraphSel,"",TXT);
VAR(G1Plots,0,U16,2,2,22);
FUNC(ArrayLoad)
{
LOOP(Loop1,22)
{
CALC(Rand,190,"RND");
LOAD(G1Plots.FuncV.1.Num,Rand);
LOAD(G1Plots.FuncV.0.Num,Set);
CALC(Set,Set,20,"+");
CALC(Num,Num,1,"+");
}
LOAD(Num,0);
LOAD(Set,0);
}
PAGE(pageName,pageStyle)
{
DRAW(graph0,420,190,gstyle,240,130);
DRAW(graph1,420,190,gstyle2,240,130);
KEY(Graph0A0D,[LOAD(FuncV,0);RUN(GraphDraw);],100,30,TOUCHR,120,250);
KEY(ResetGK,[RESET(graph0,graph1);;],100,30,TOUCH,240,250);
KEY(Graph1A1D,[LOAD(FuncV,1);RUN(GraphDraw);],100,30,TOUCHR,360,250);
}
FUNC(GraphDraw)
{
RUN(ArrayLoad);
LOAD(GraphSel,"graph",FuncV);
RESET(GraphSel);
DRAW(GraphSel,G1Plots.FuncV.0,G1Plots.FuncV.1);;
}
SHOW(pageName);
|