New Page 1

How To Do - Example Projects

Click on the title to open the example project
Click on the How to projects above to see the basic sample code to help you create your projects quickly and efficiently.
Each "How To" has a overall description as well as a basic line by line detail of code.
You can download the project or copy the menu file to clipboard
 
Basic Entities     Basic animation     Basic functions  
Add Image   Create button   Basic math operations
Draw colour boxes   Show page - multiple pages   Math functions
Draw colour lines   Flashing text message   Create random number
Draw colour vectors   Animation with pointers   Plus and Minus
Draw colour circles   Scroll text message   Show and format Time and Date
Draw colour ellipses   Move images (TouchX, TouchY)   Save Timestamp to text file  
Draw arcs (ellipses with angle)   Move images with buttons   Password Entry Lock  
Add multiple rows text     Move images (press button)     Menu Selection  
Use pointers   Create slider      
Text Hello World   Show and hide entities   Graphs
Create Dynamic Entities     Dial needle   Create X-Bar Graph
      PNG Transparency     Create Y-Bar Graph  
Interfaces and Hardware             Trace graph from array  
Create IO Counter           Draw sinusoid graph   
External Key             Draw graph - DNA style
Use A to D converters           Draw line graph  
Send and receive data - RS232          
Keyboard Control            


How to create X-Bar Graph

Add background image to library

Create a style for page
Create a style for the xBar graph
Create a style for the box,

Create a Variables YVal, XVal and Count

Define a page named "pageName" with style "pageStyle"

Create Graph 420,210 at 240, 145
Create Box 420, 210 at 240, 145 acts as a border of the graph
Create Page loop that runs forever

Calculate a Random value from 0 to 420 into XVal
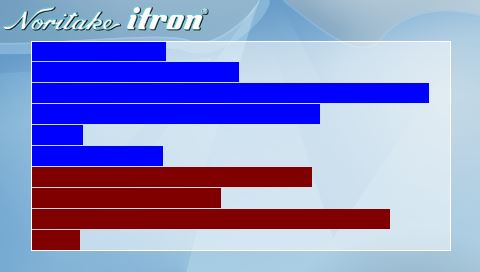
Draw x bar graph at XVal,YVal
Increment YVal by 21
Add a wait so you can see graph drawing
Increment count by 1
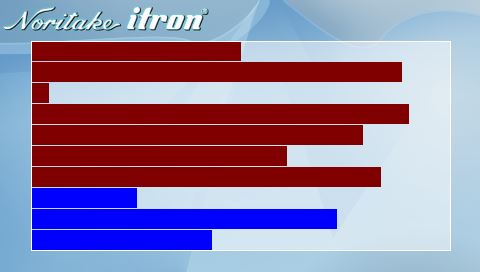
Check count value if equals 10 reset YVal and change graph colour
Check count value if equals 20 reset YVal and count and change graph colour

After loading show the page

LIB(background,"SDHC/bground.png");

STYLE(pageStyle, Page) {image=background;}
STYLE(gstyle,DRAW) {type=xbar;col=blue;back=\\80ffffff;width=20;curRel=CC;xorigin=20;}
STYLE(bstyle,DRAW) {type=b; col=White; width=1;}

VAR(YVal,1,U16);VAR(XVal,0,U16);VAR(Count,0,U8);

PAGE(pageName, pageStyle)
{
DRAW(graph1,420,210,gstyle,240,145);
DRAW(graphb,420,210,bstyle,240,145);
LOOP(graph,FOREVER)
{
CALC(XVal,420,"RND");
DRAW(graph1,XVal,YVal);;
CALC(YVal,YVal,21,"+");
WAIT(300);
CALC(Count,Count,1,"+");
IF(Count=10?[LOAD(YVal,1);LOAD(gstyle.col,maroon);]);
IF(Count=20?[LOAD(YVal,1);LOAD(gstyle.col,blue);LOAD(Count,0);]);
}
}
SHOW(pageName);